如果你想简单、轻量使用,那么这个组合可能不适合你,请使用ServerStatus或者哪吒。
Grafana 是一个开源的分析和可视化平台,用于构建动态的仪表盘,支持从多种数据源提取数据。 可以让你嘎嘎自定义


Prometheus可采集哪些数据:
基础设施:服务器、存储、网络设备。
应用:Web 应用、数据库、缓存服务。
容器:Docker、Kubernetes。
云环境:AWS、Azure、GCP。
业务指标:用户行为、关键业务数据。
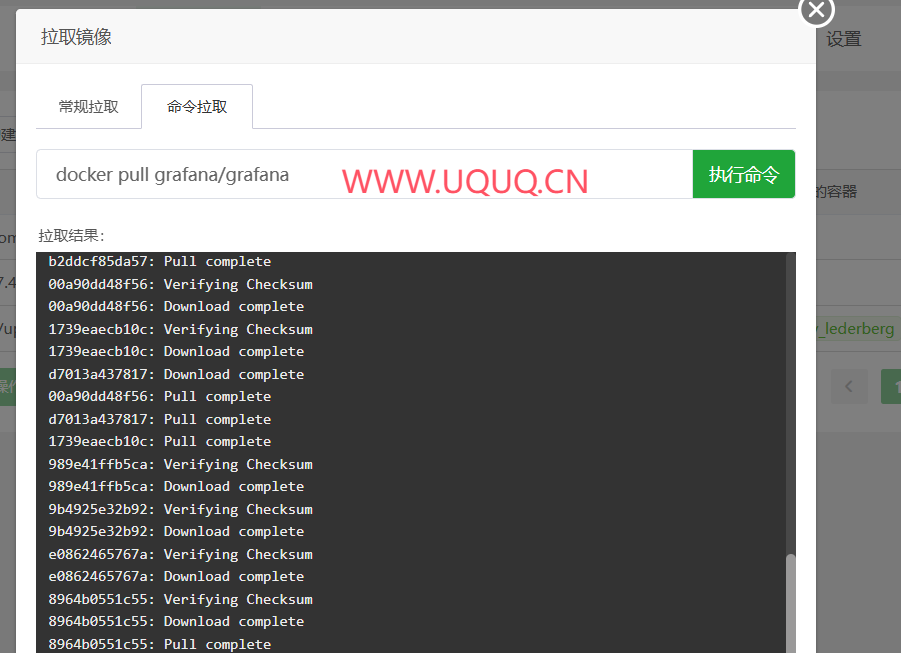
一、拉取镜像
如果你服务器是国内拉取不了镜像,请换源。
echo '{"registry-mirrors": ["https://docker.1ms.run"]}' | sudo tee /etc/docker/daemon.json > /dev/null
systemctl daemon-reload
systemctl restart docker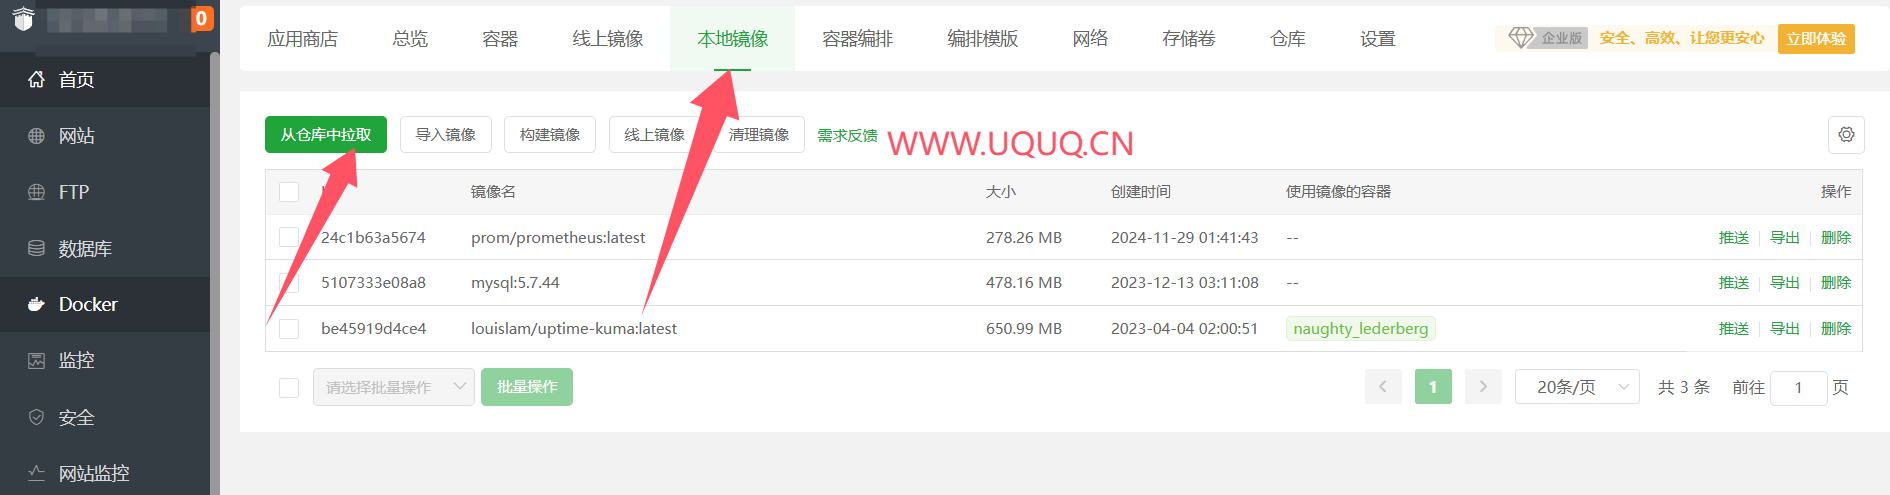
docker pull prom/prometheus:latest
docker pull grafana/grafana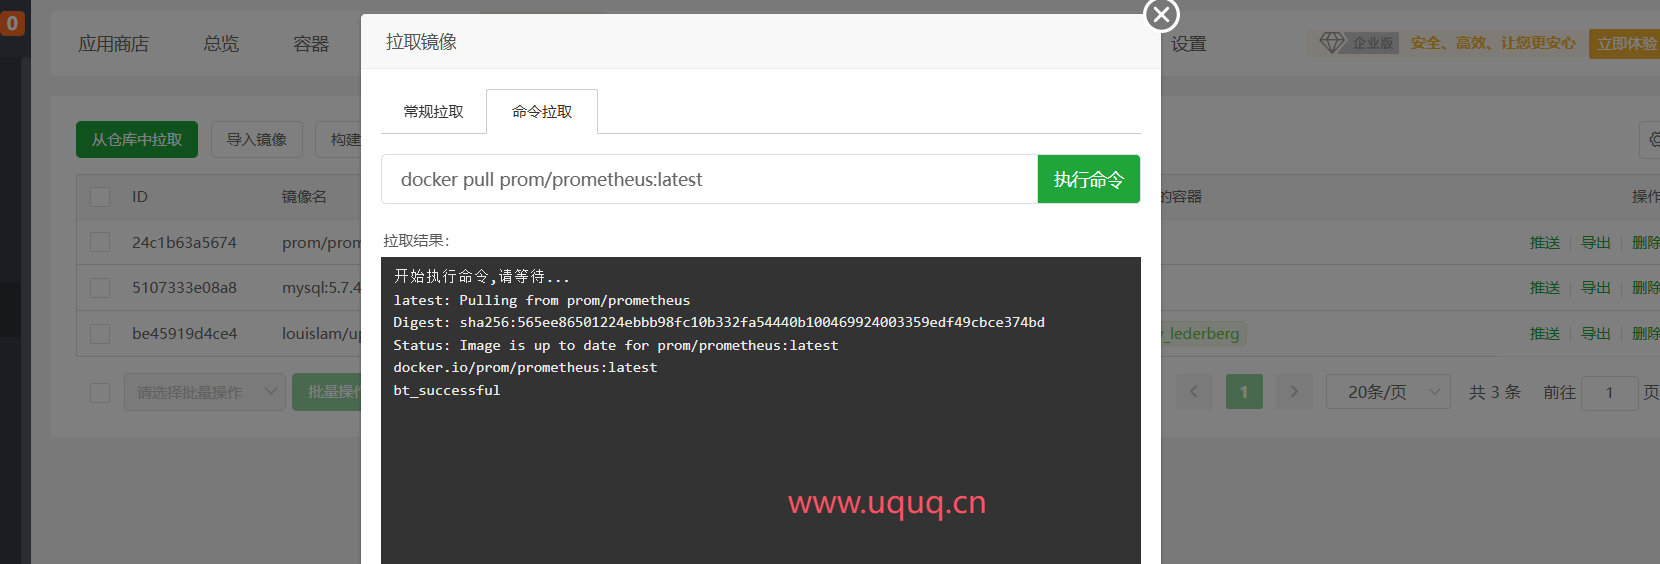
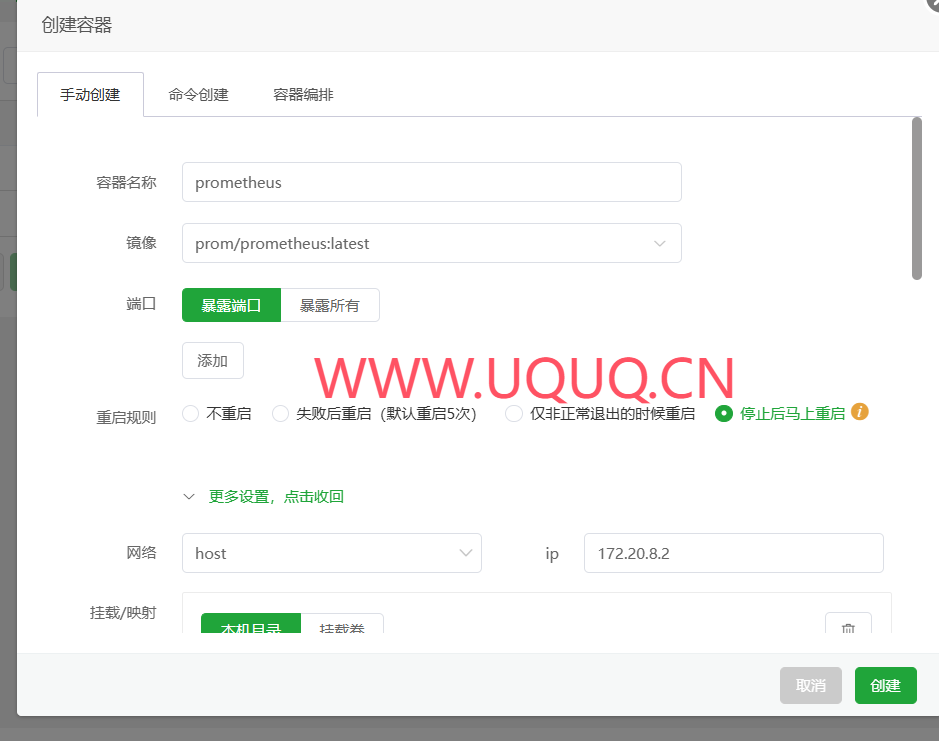
二、创建容器
grafana
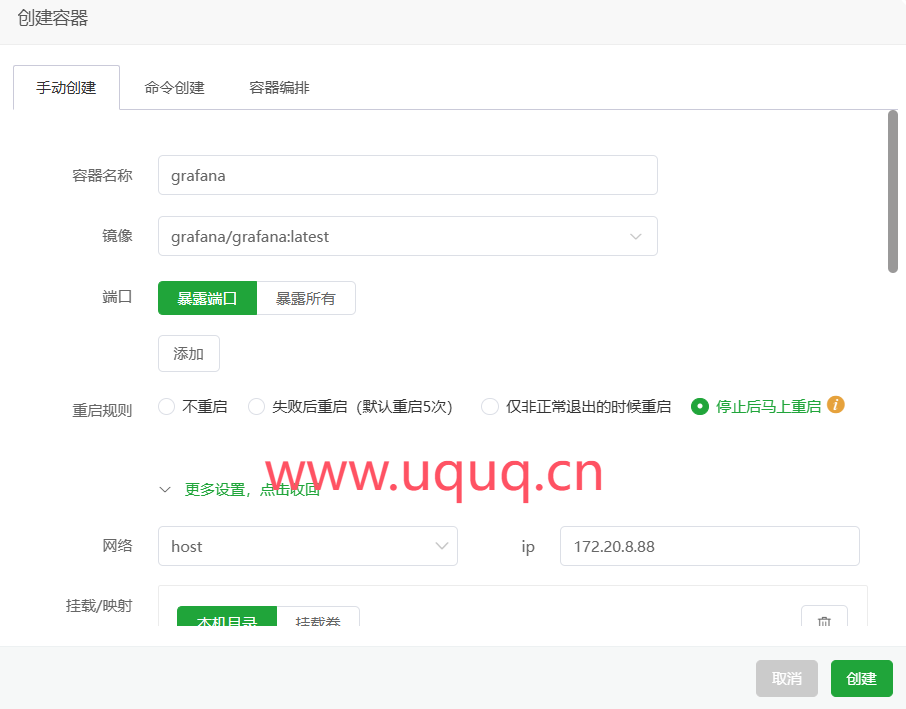
设置数据存储位置
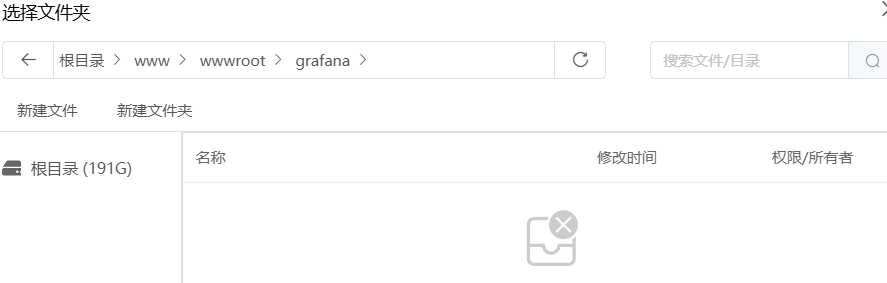
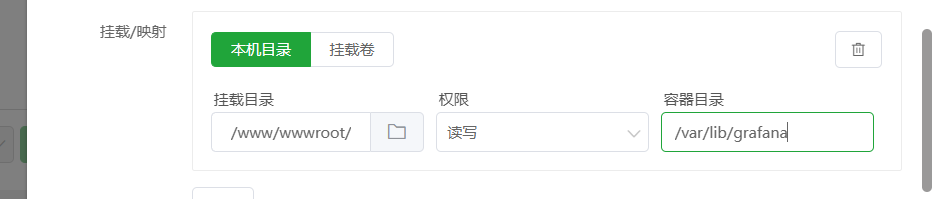
修改文件夹权限777

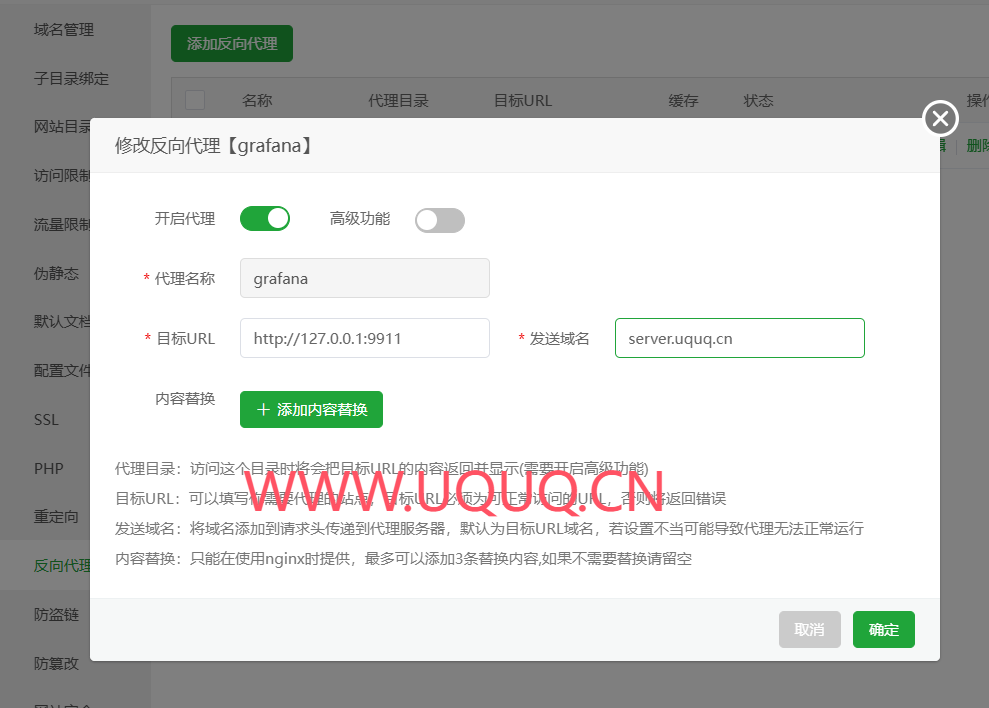
默认端口是3000 可修改
GF_SERVER_HTTP_PORT=9911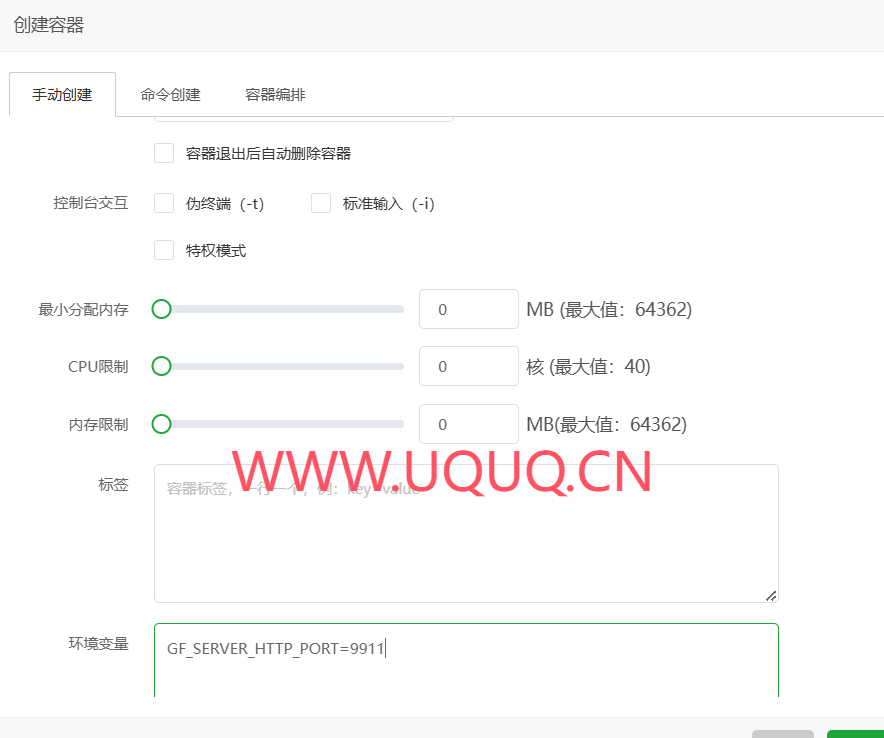
创建网站并添加反向代理
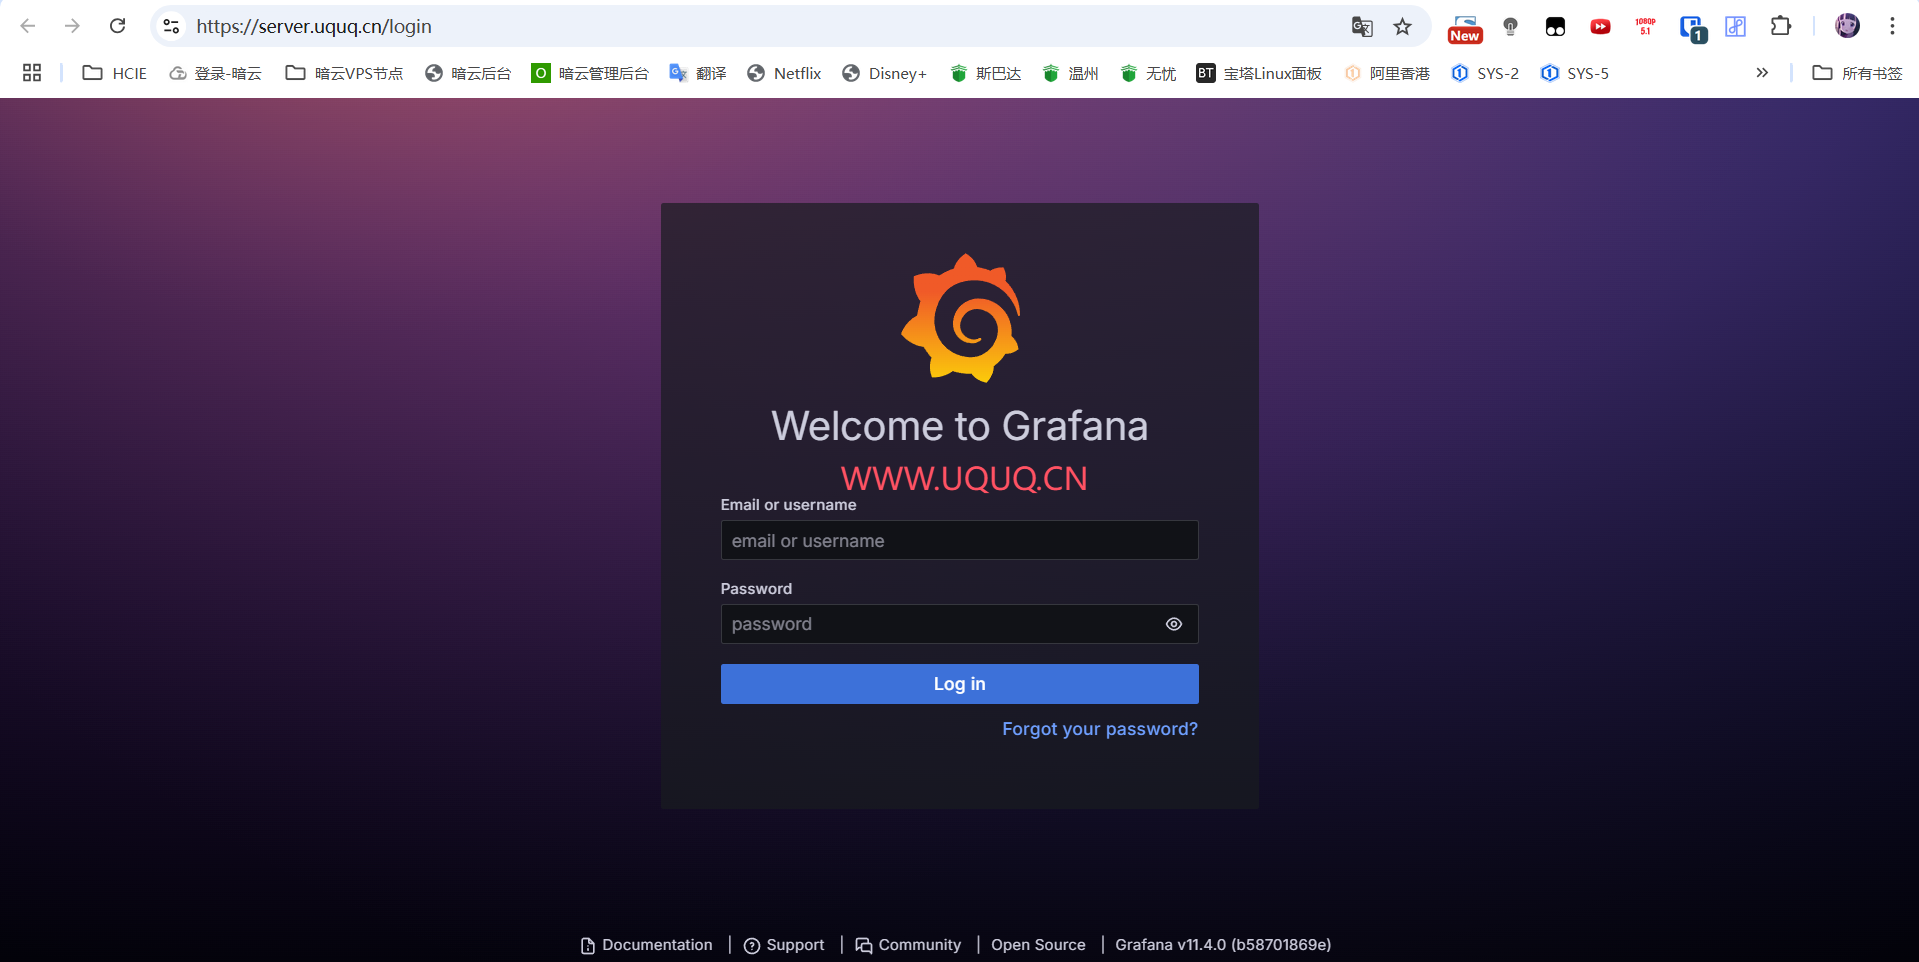
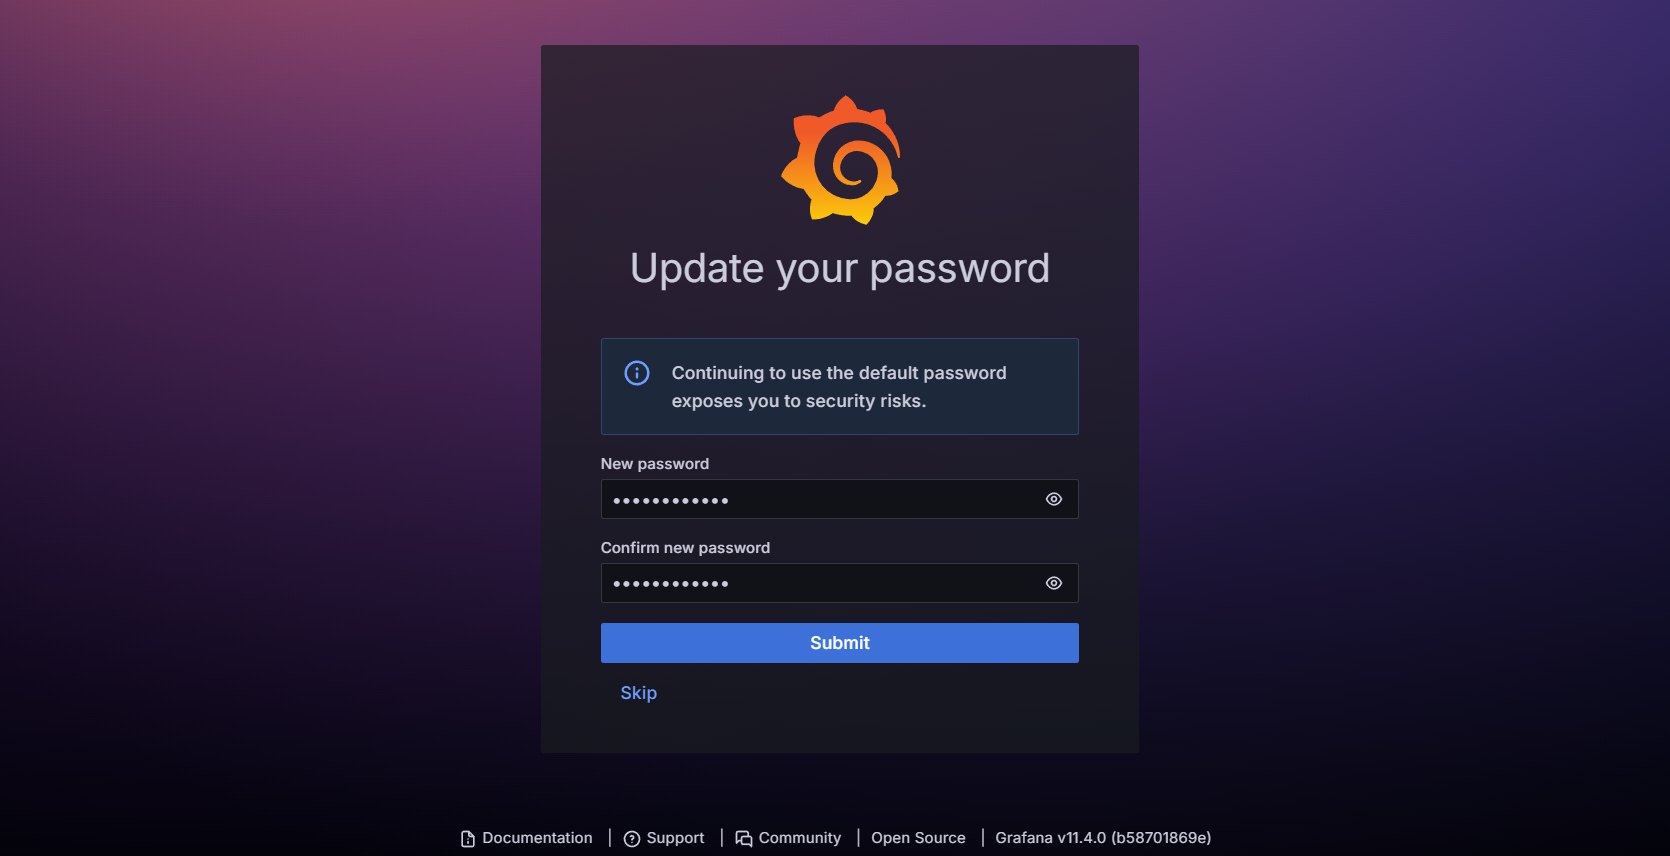
默认账户密码 admin admin 进去后会让你设置新密码也可跳过
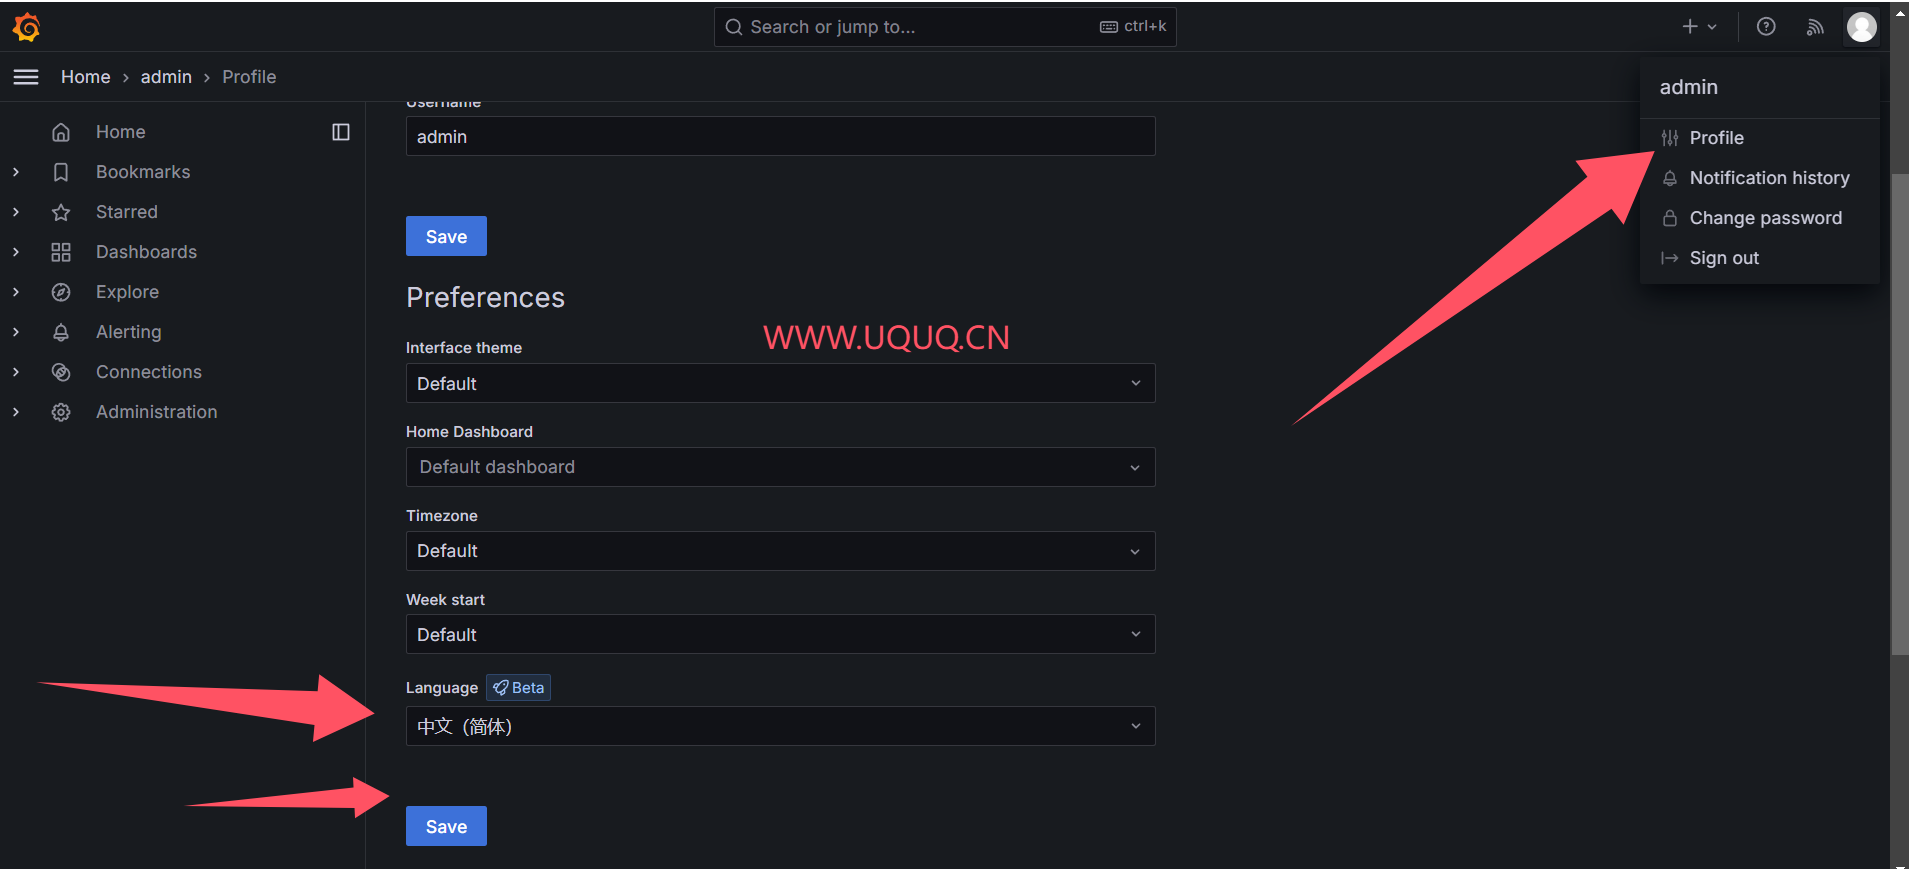
设置中文
prometheus
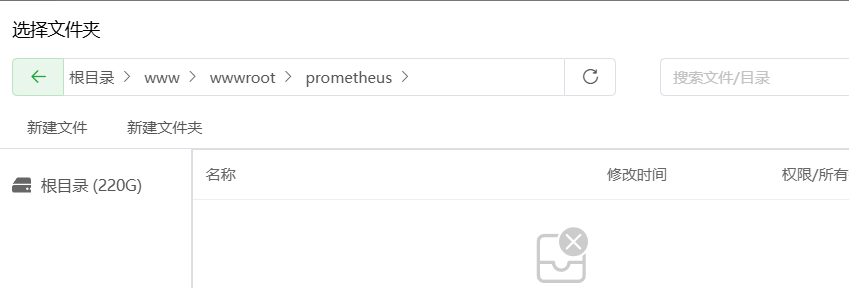
建两个目录
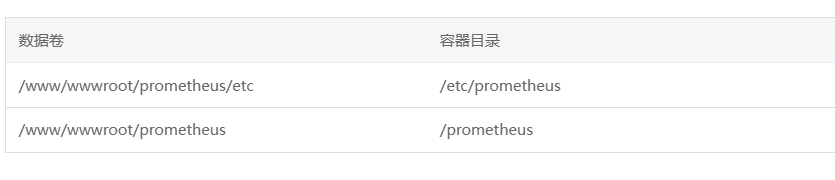
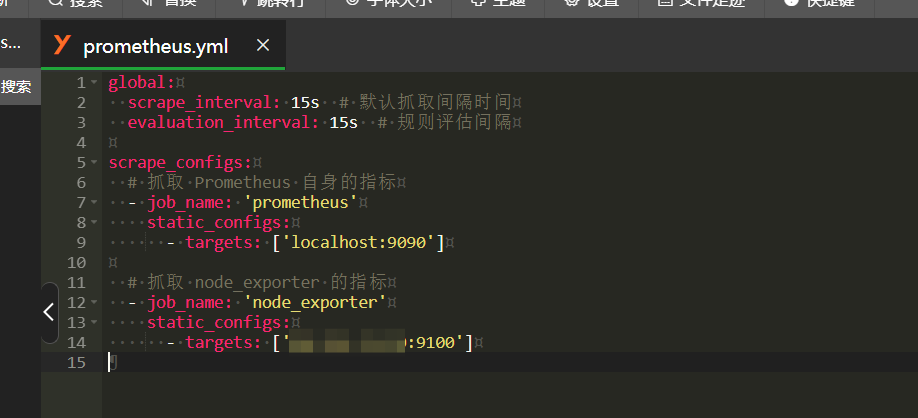
在/www/wwwroot/prometheus/etc/ 新建一个prometheus.yml文件后期好添加节点
global:
  scrape_interval: 15s  # 默认抓取间隔时间
  evaluation_interval: 15s  # 规则评估间隔

scrape_configs:
  # 抓取 Prometheus 自身的指标
  - job_name: 'prometheus'
    static_configs:
      - targets: ['localhost:9090']
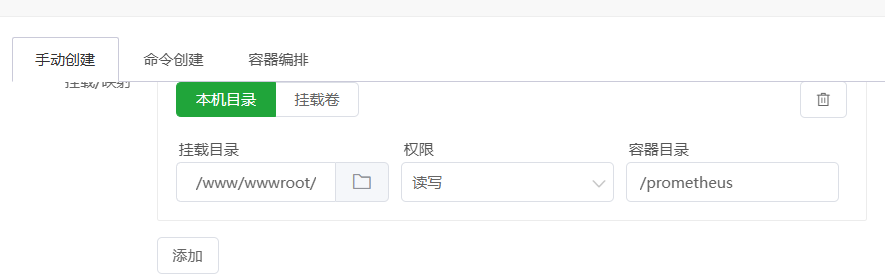
设置权限

设置端口(找的几个参数对Docker都没有用。选bridge的话可以直接映射端口 ,就这样吧,为什么选HOST没选bridge呢,因为选HOST方便两个容器通信。)
然后点击确认 创建容器
默认端口9090访问查看是否正常

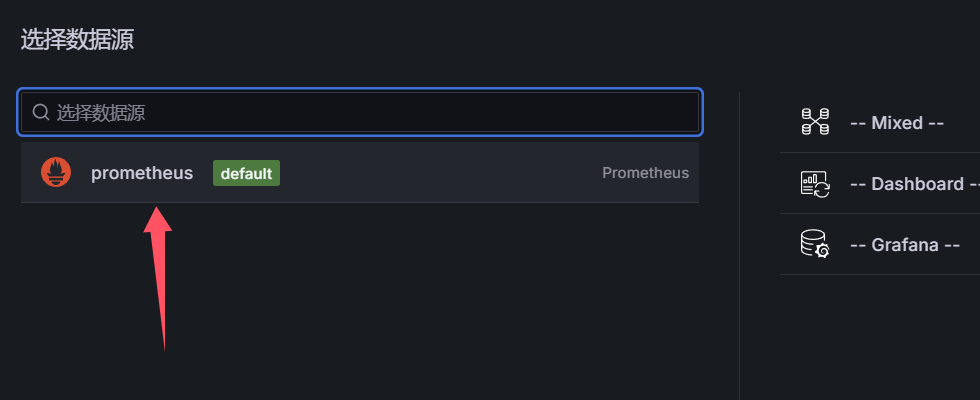
三、关联
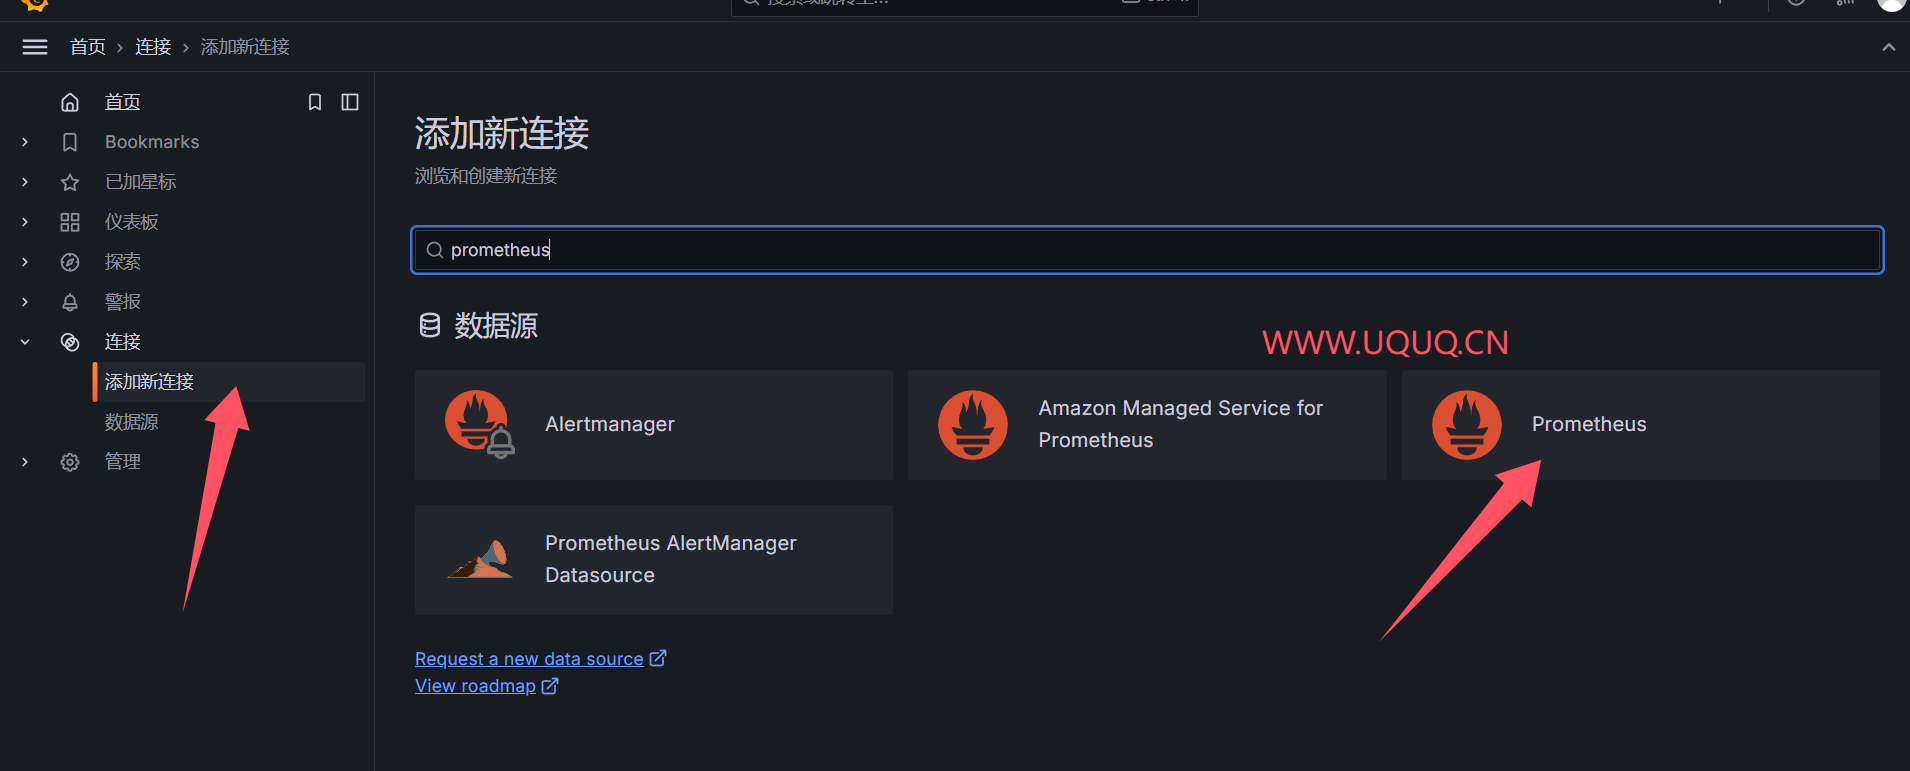


四、添加节点
连上SSH,下载节点文件。
https://prometheus.io/download/#node_exporter
Linux:https://github.com/prometheus/node_exporter/releases/download/v1.8.2/node_exporter-1.8.2.linux-amd64.tar.gz
wget https://github.com/prometheus/node_exporter/releases/download/v1.8.2/node_exporter-1.8.2.linux-amd64.tar.gz
tar -xvzf node_exporter-1.8.2.linux-amd64.tar.gz
sudo mv node_exporter-1.8.2.linux-amd64/node_exporter /usr/local/bin/
sudo vi /etc/systemd/system/node_exporter.service
[Unit]
Description=Node Exporter
After=network.target
[Service]
Type=simple
ExecStart=/usr/local/bin/node_exporter
Restart=always
RestartSec=5s
User=nobody
[Install]
WantedBy=multi-user.target
启用并启动服务
sudo systemctl daemon-reload
sudo systemctl enable node_exporter
sudo systemctl start node_exporter
解释
启动服务:
sudo systemctl start node_exporter
停止服务:
sudo systemctl stop node_exporter
重启服务:
sudo systemctl restart node_exporter
设置开机启动:
sudo systemctl enable node_exporter
取消开机启动:
sudo systemctl disable node_exporter
查看服务状态:
sudo systemctl status node_exporter
自定义端口后面在说吧。。懒得整了
访问服务器IP:9100 显示即可

然后去rometheus添加节点
/www/wwwroot/prometheus/etc/prometheus.yml
重启容器

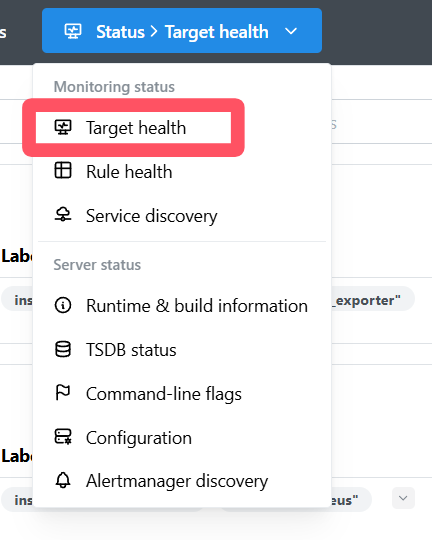
访问prometheus IP:9090 可看见节点

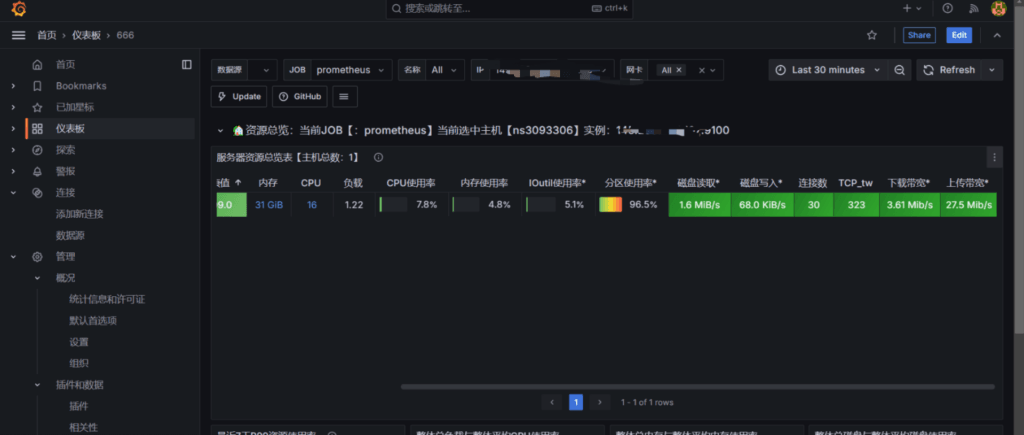
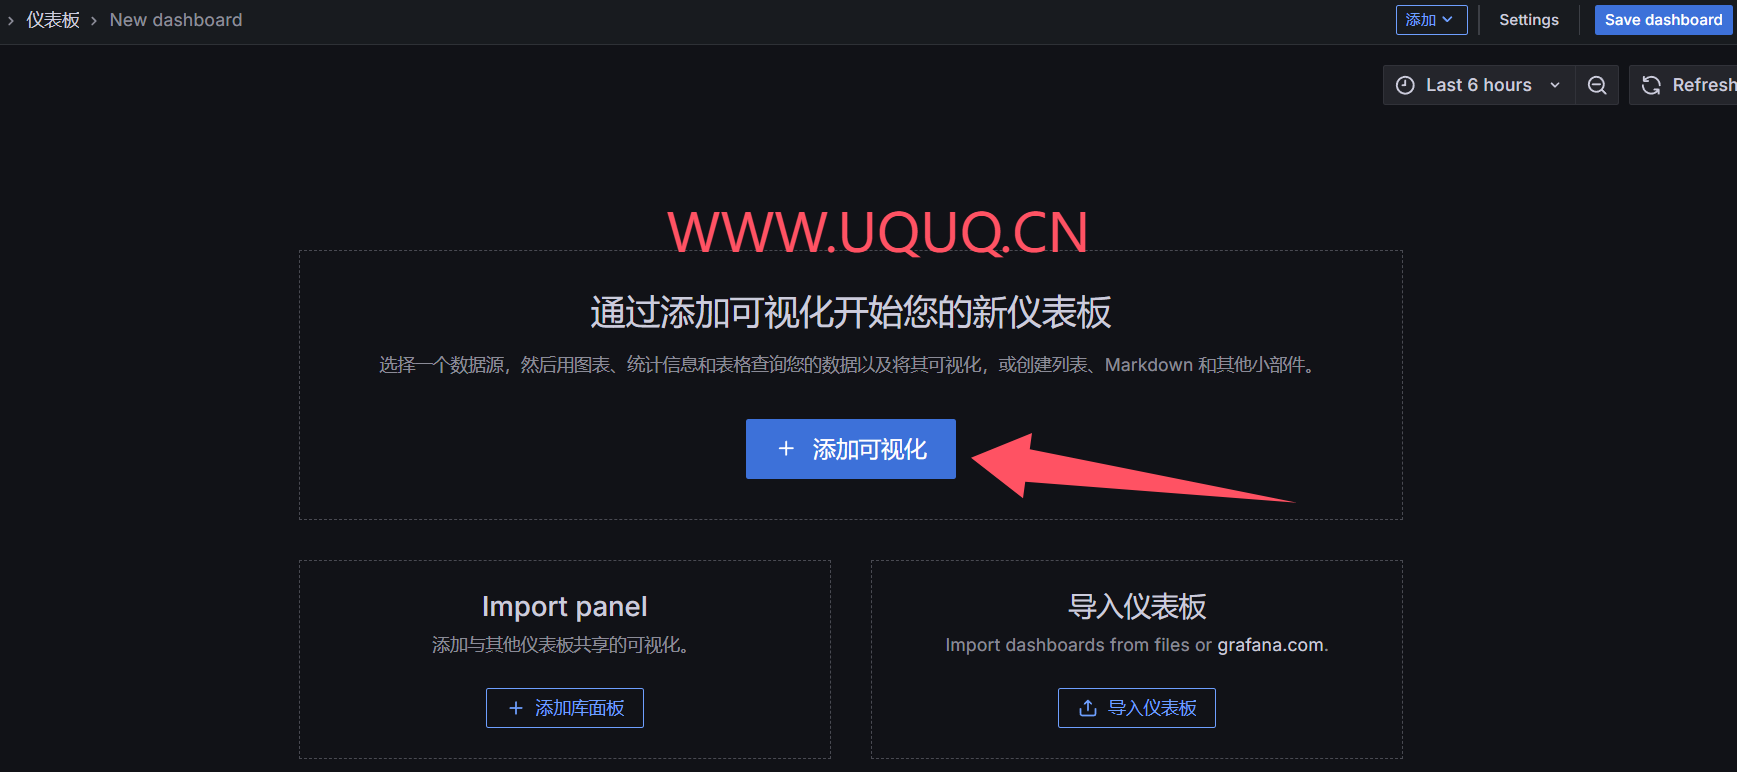
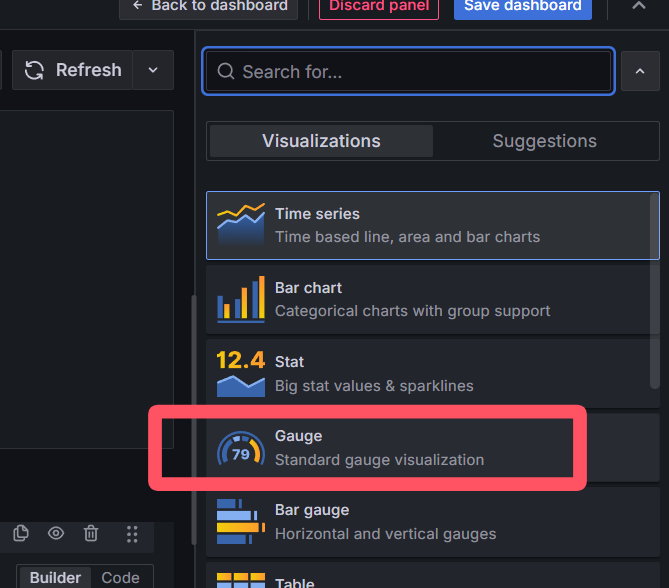
五、创建仪表盘
可以自己DIY,也可以用别人做好的。
别人做的模板:https://grafana.com/grafana/dashboards/
我这里使用16098 (由StarsL.cn制作)
新建仪表盘


搞定!


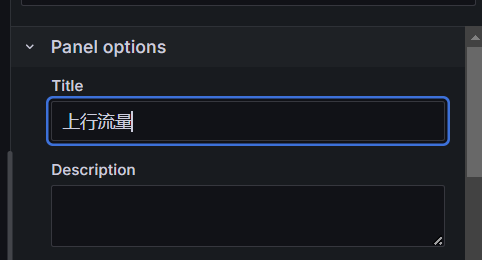
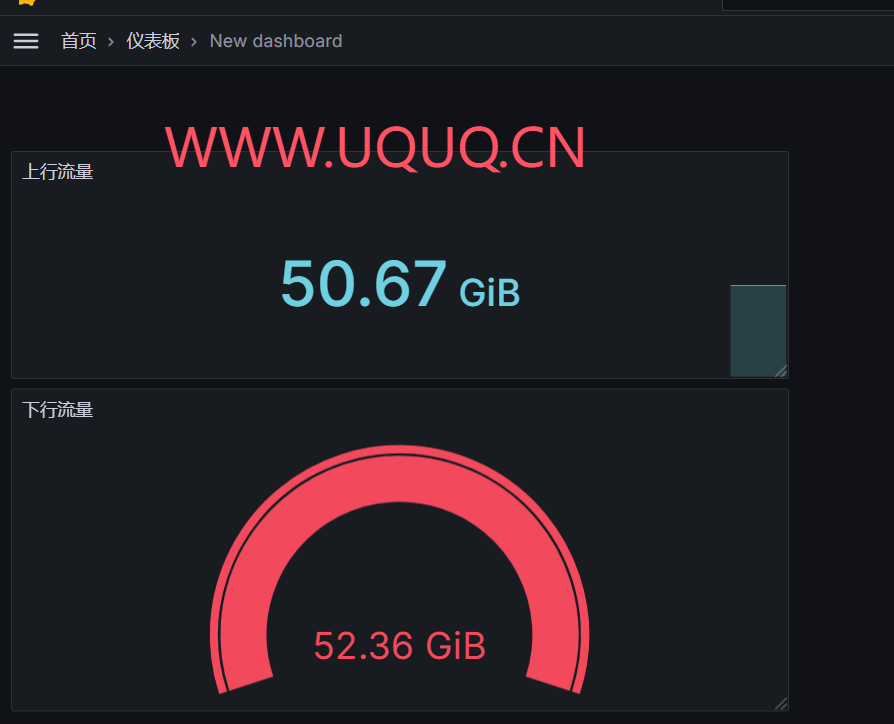
DIY可以玩出花 这里我新建一个仪表盘 统计服务器下载上传流量为例
上行:node_network_transmit_bytes_total
下行:node_network_receive_bytes_total
其他参数等等文档:那个框可打开查看

要先Run一下 才会显示数据 然后选择网卡

单位 小数点 等等

下行以此类推
六、节点监控网络质量http icmp tcp等 prometheus监控之黑盒(blackbox)监控
PS:这个图片是偷的

https://github.com/prometheus/blackbox_exporter/
cd /root
wget https://github.com/prometheus/blackbox_exporter/releases/download/v0.25.0/blackbox_exporter-0.25.0.linux-amd64.tar.gz
tar -xvzf blackbox_exporter-0.25.0.linux-amd64.tar.gz
mv blackbox_exporter-0.25.0.linux-amd64 blackbox_exporter
cd /root/blackbox_exporter
vi blackbox.yml
这里只使用
modules:
http_2xx:
prober: http
http:
method: GET
http_post_2xx:
prober: http
http:
method: POST
tcp_connect:
prober: tcp
icmp:
prober: icmp
#按需选择
icmp:
prober: icmp
icmp_ttl5:
prober: icmp
timeout: 5s
icmp:
ttl: 5
http_2xx:
prober: http
http:
preferred_ip_protocol: "ip4"
http_post_2xx:
prober: http
http:
method: POST
tcp_connect:
prober: tcp
pop3s_banner:
prober: tcp
tcp:
query_response:
- expect: "^+OK"
tls: true
tls_config:
insecure_skip_verify: false
grpc:
prober: grpc
grpc:
tls: true
preferred_ip_protocol: "ip4"
grpc_plain:
prober: grpc
grpc:
tls: false
service: "service1"
ssh_banner:
prober: tcp
tcp:
query_response:
- expect: "^SSH-2.0-"
- send: "SSH-2.0-blackbox-ssh-check"
irc_banner:
prober: tcp
tcp:
query_response:
- send: "NICK prober"
- send: "USER prober prober prober :prober"
- expect: "PING :([^ ]+)"
send: "PONG ${1}"
- expect: "^:[^ ]+ 001"
sudo vi /etc/systemd/system/blackbox_exporter.service[Unit]
Description=Blackbox Exporter
After=network.target
[Service]
Type=simple
ExecStart=/root/blackbox_exporter/blackbox_exporter --config.file=/root/blackbox_exporter/blackbox.yml
Restart=always
[Install]
WantedBy=multi-user.target
重新加载 systemd 配置:
sudo systemctl daemon-reload
启动服务:
sudo systemctl start blackbox_exporter
设置开机自启:
sudo systemctl enable blackbox_exporter
验证是否运行:
sudo systemctl status blackbox_exporter
http://<服务器IP>:9115
编辑rometheus配置文件
/www/wwwroot/prometheus/etc/prometheus.yml 保存后重启容器
#tcp检查配置
  - job_name: "blackbox_tcp"
    metrics_path: /probe
    params:
      module: [tcp_connect]
    static_configs:
      - targets:
        - 36.160.4.166:80
        - 220.250.70.165:80
    relabel_configs:
      - source_labels: [__address__]
        target_label: __param_target
      - source_labels: [__param_target]
        target_label: instance
      - target_label: __address__
        replacement: 88.151.33.50:9115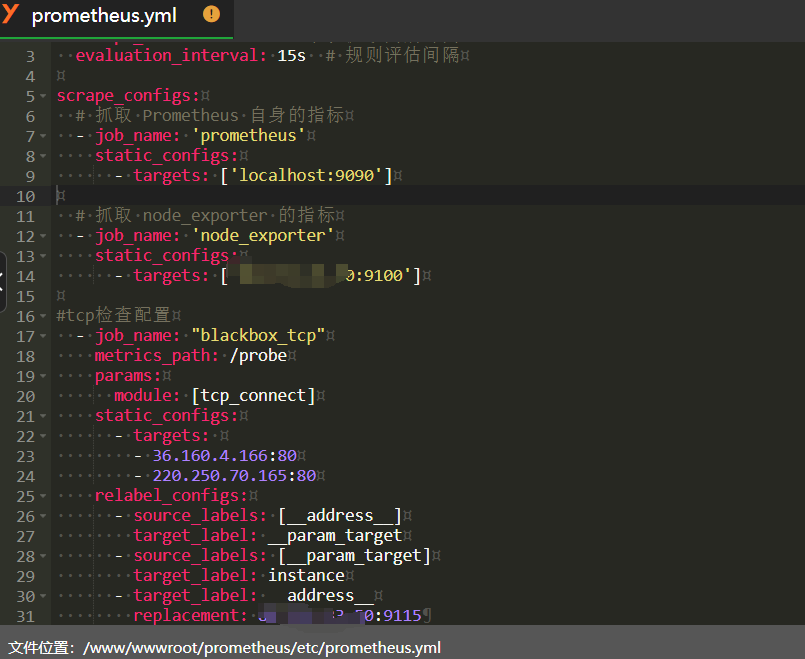
导入仪表盘/在自己的仪表盘上添加
这里方便演示 用的9965 导入和上面一样
右侧不显示 是因为缺组件

好麻烦 好麻烦 好麻烦 在次建议 不想弄的选轻量化探针。。

评论 (0)